

Wyckoff Method -اسلوب ويكوف
May 29, 2025
All posts are NOT to be interpreted or used as financial advice
لا يُفسَّر أو يُستخدم أي من المشاركات كنصائح مالية
New Update
🚨 What Just Happened:
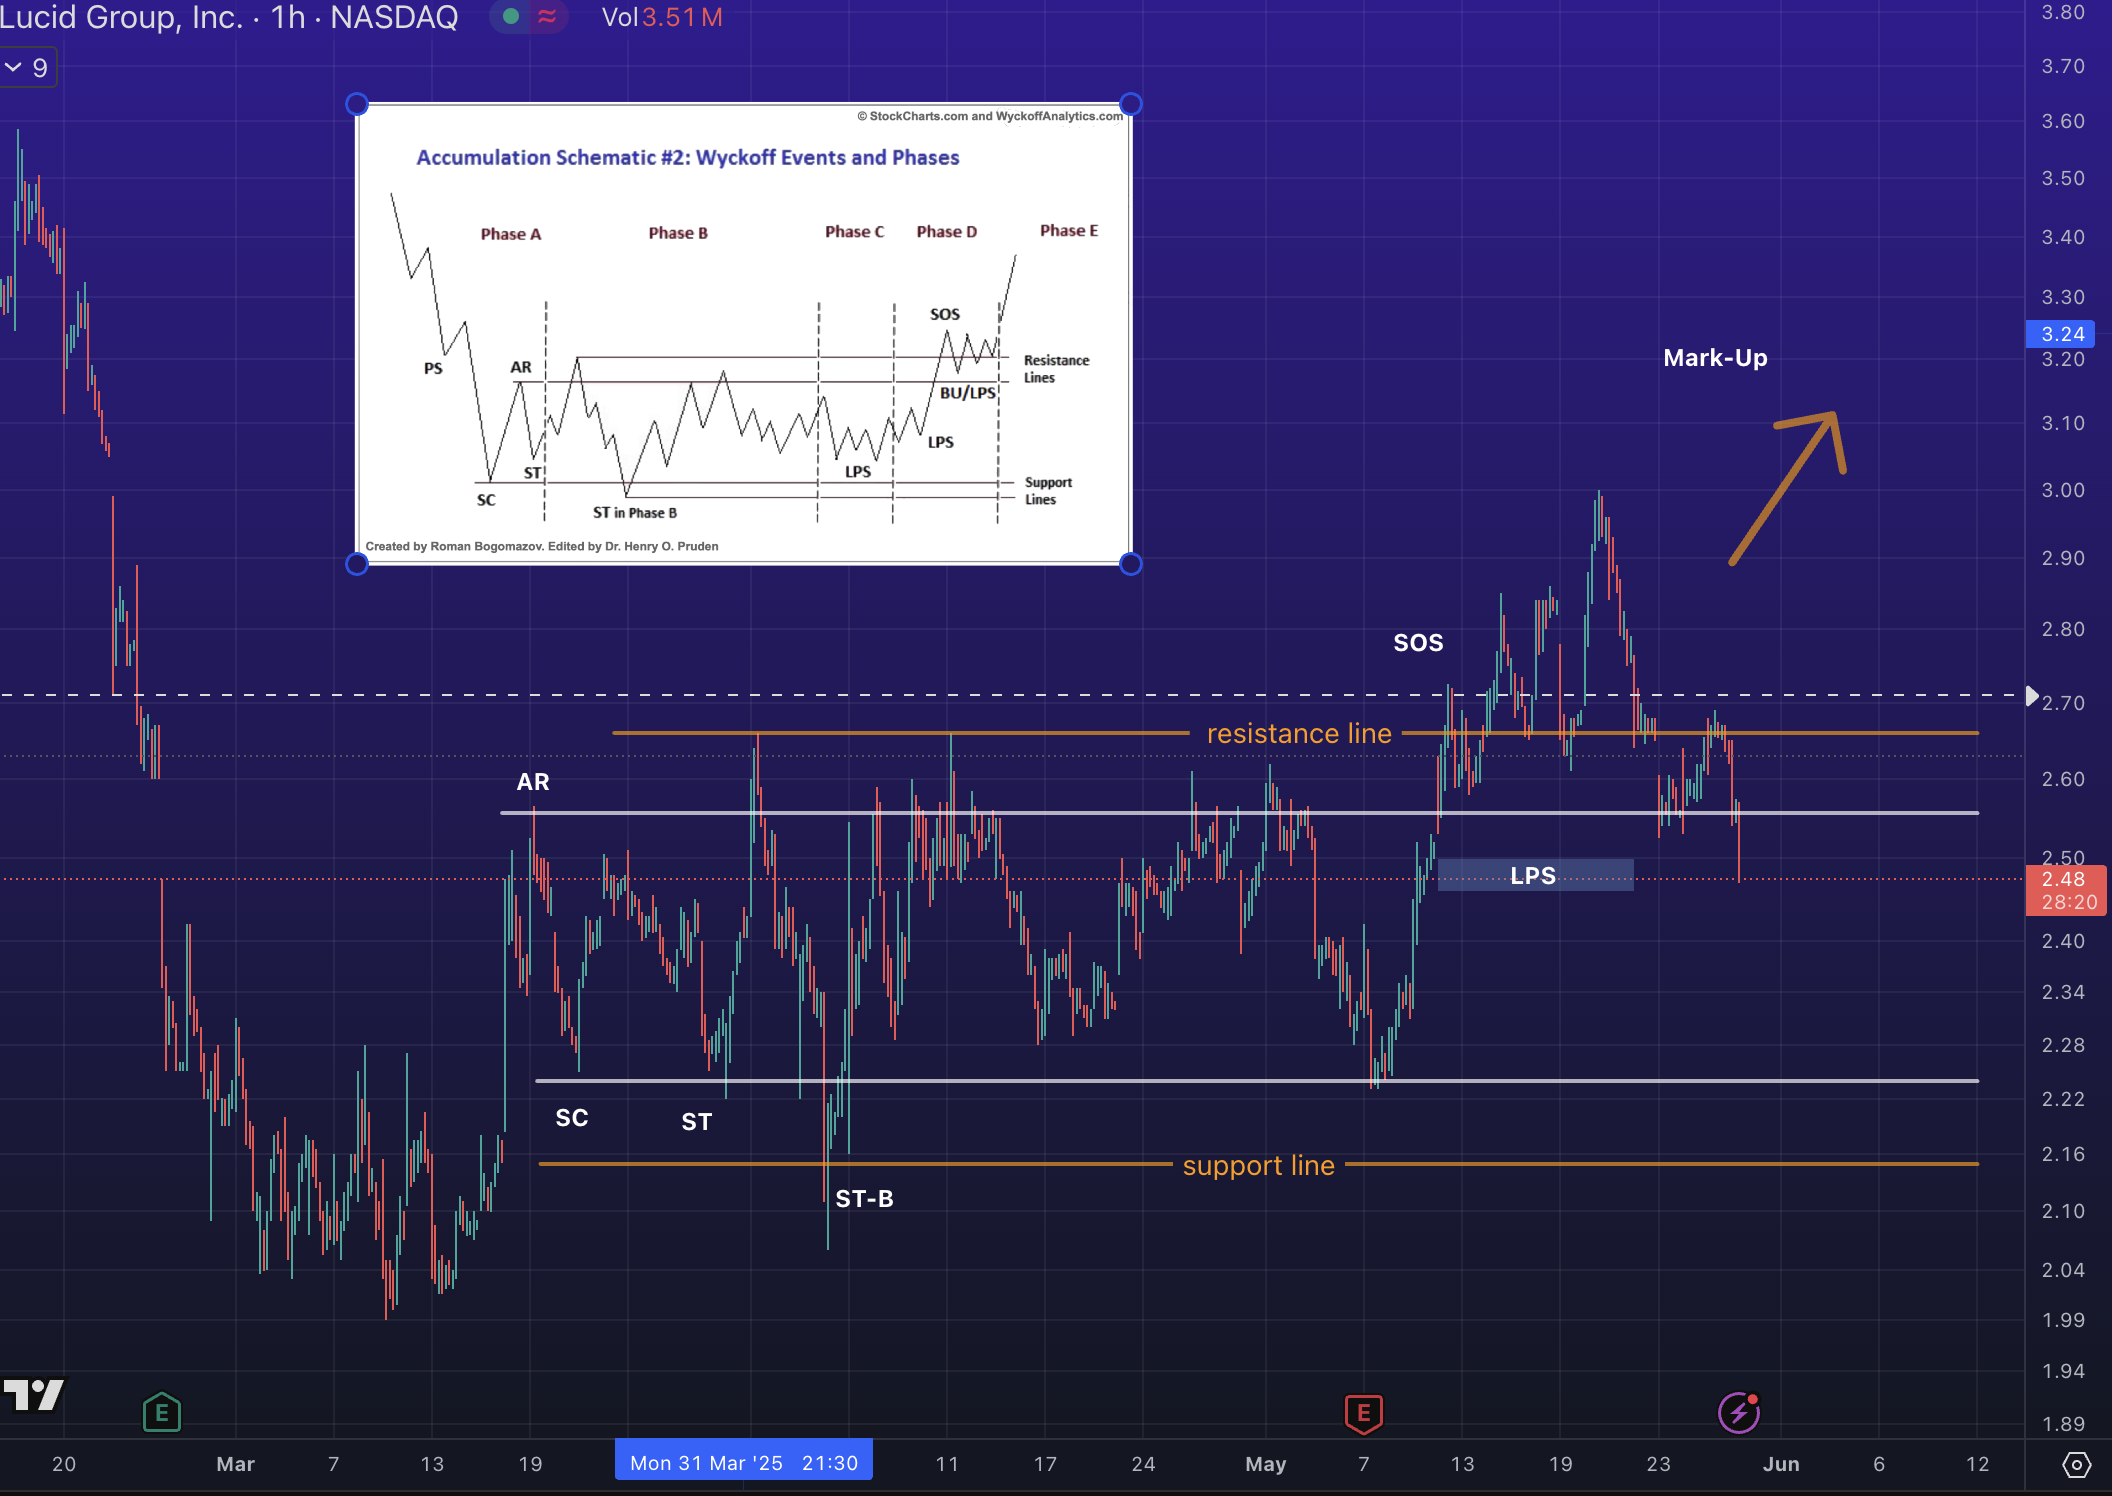
- The expected Mark-Up did not sustain.
- Price back to the LPS, which invalidates the bullish Phase D continuation, at least temporarily.
This looks like either:
- A failed breakout (UTAD-style move) from a reaccumulation zone. “AKA distribution”
- Or possibly a retest of Phase C (price may go test support ~2.28–2.22 area again).
- my targeted support is at -> 2.39 | 2.27 | 2.17-2.10
2.17 is key to maintain bullishness
تحديث جديد
ما الذي حدث؟🚨
الصعود المتوقع لم يستمر
عاد السعر إلى مستوى (إل بي اس)، مما يبطل استمرار المرحلة الصاعدة (دي)، على الأقل مؤقتاً
يبدو أن ما حدث هو أحد احتمالين
اختراق فاشل (نمط يو تي أي يو) من منطقة إعادة تجميع، أي أنها كانت توزيعاً
أو احتمال إعادة اختبار للمرحلة “سي” (وقد يذهب السعر لاختبار الدعم عند منطقة ٢٫٢٨ – ٢٫٢٢)
مناطق الدعم المستهدفة لدي هي: ٢٫٣٩ | ٢٫٢٧ | ٢٫١٧ – ٢٫١٠
٢،١٧ هو المستوى الأساسي للحفاظ على الاتجاه الصاعد
Volume Profile – ملف الحجم والفجوات
May 22, 2025
All posts are NOT to be interpreted or used as financial advice
لا يُفسَّر أو يُستخدم أي من المشاركات كنصائح مالية
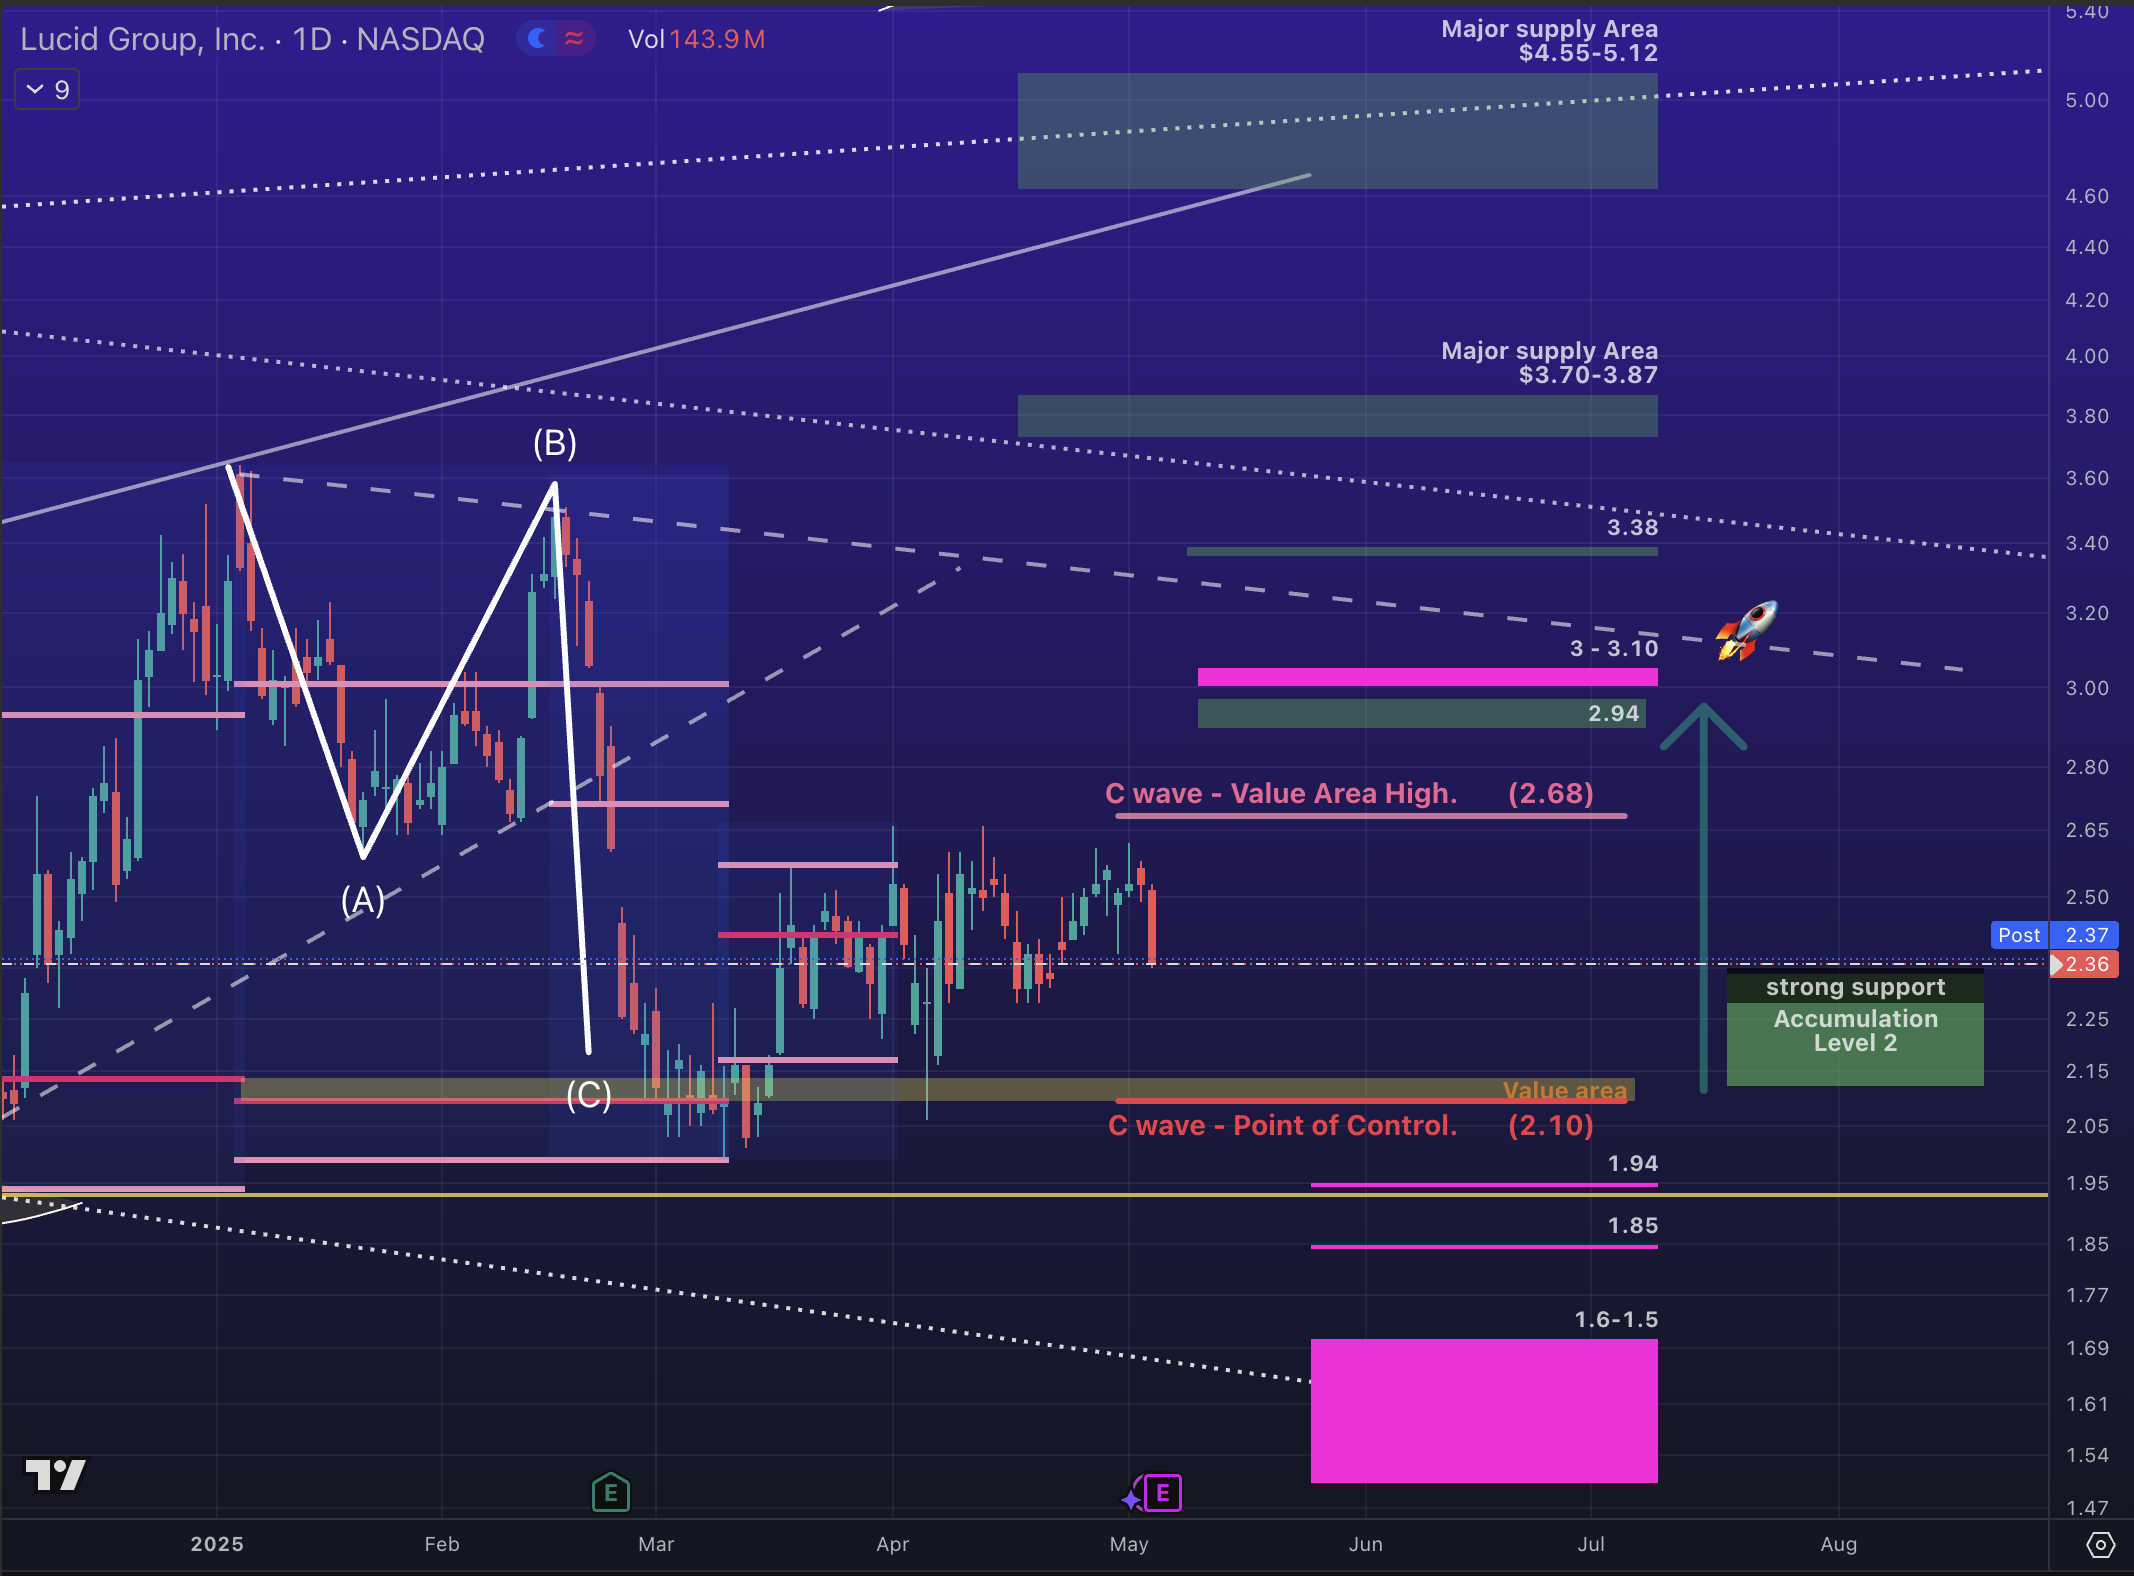
Quick Update
⭐️For the full outlook, refers to below update dated (May 17)
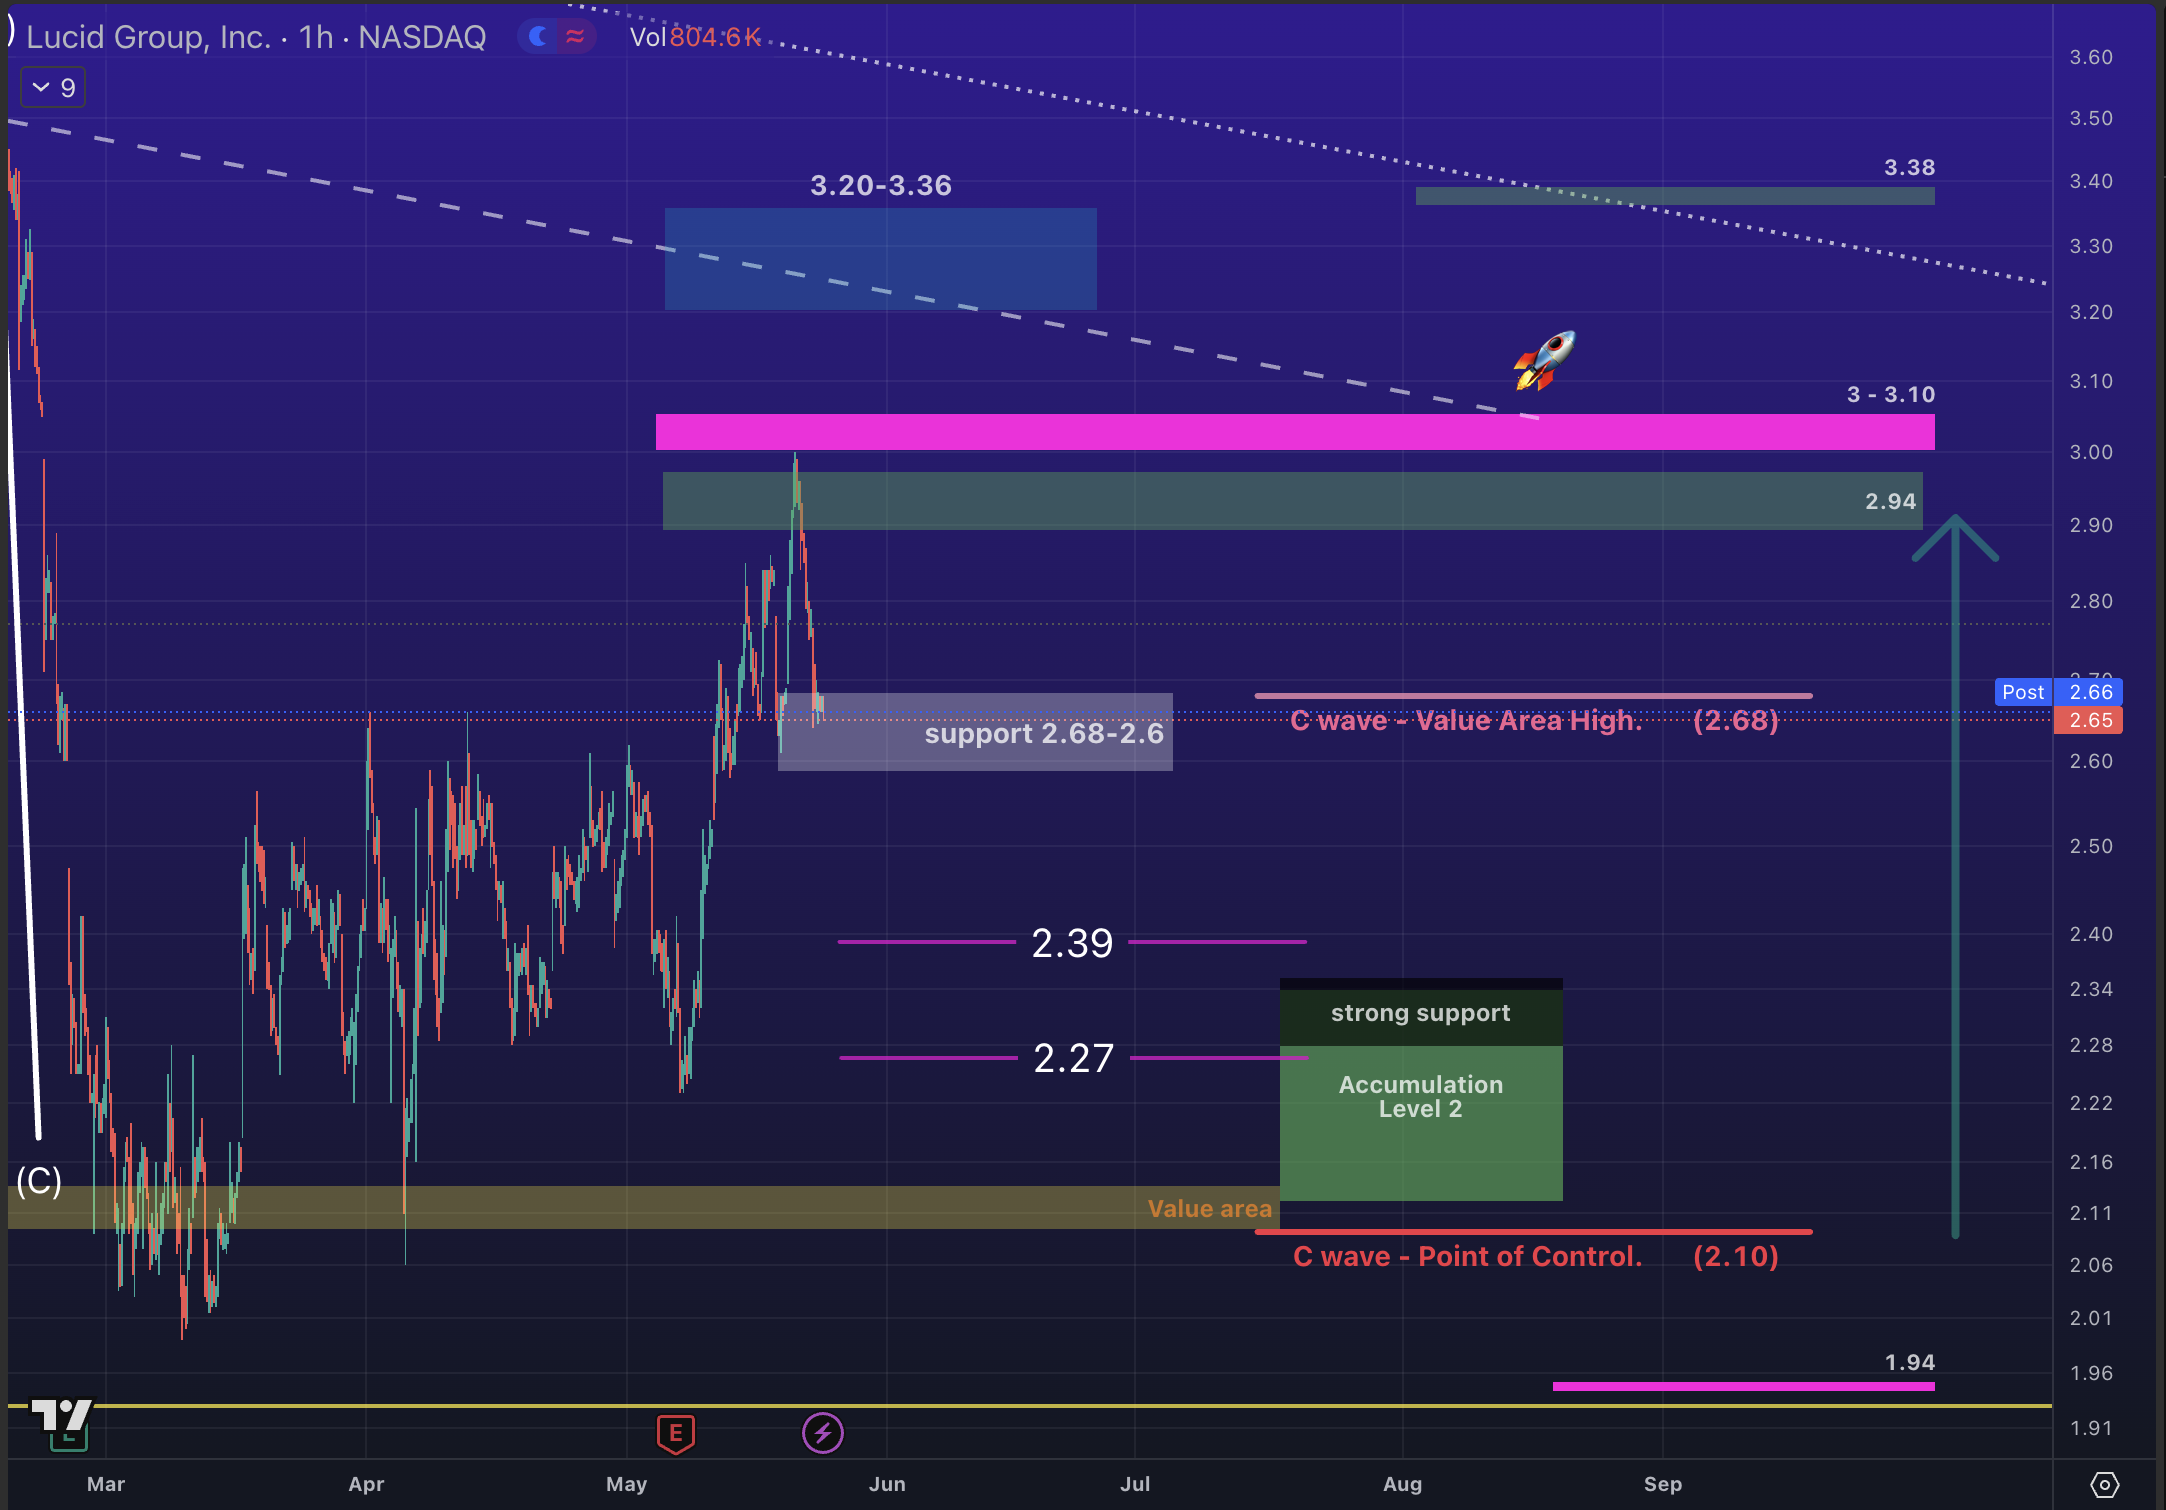
simply we rejected $3 or Value Area High of the previous top
1️⃣ must hold support @ 2.68 – 2.6
2️⃣ if we rejected support, then -> 2.39 | 2.27 | 2.17-2.10
3 – 3.10 is key to achieve higher
🐻 Bearish price targets when crossing $2.10
1.99 Low -> 1.94 -> 1.85 -> (1.6-1.5)
2.17 is key to maintain bullishness
تحديث سريع
للاطلاع الكامل على التحديث، يُرجى الرجوع إلى التحديث بتاريخ (١٧ مايو)⭐️
ببساطة، تم رفض مستوى ٣دولار أو الحد العلوي لمنطقة القيمة للقمة السابقة
١- يجب الثبات على الدعم بين ٢٫٦٨ – ٢٫٦٠
٢- إذا تم كسر الدعم، فالهدف التالي -> ٢٫٣٩ | ٢٫٢٧ | ٢٫١٧ – ٢٫١٠
٣- ٣,١٠ هو المستوى الرئيسي لتحقيق ارتفاع أكبر
الأهداف السعرية الهابطة عند كسر ٢٫١٠ دولار 🐻
١٫٩٩ كأدنى سعر ← ١٫٩٤ ← ١٫٨٥ ← (١٫٦ – ١٫٥)
٢،١٧ ٢٫١٠ هو المستوى الأساسي للحفاظ على الاتجاه الصاعد
Volume Profile – ملف الحجم والفجوات
May 17, 2025
All posts are NOT to be interpreted or used as financial advice
لا يُفسَّر أو يُستخدم أي من المشاركات كنصائح مالية
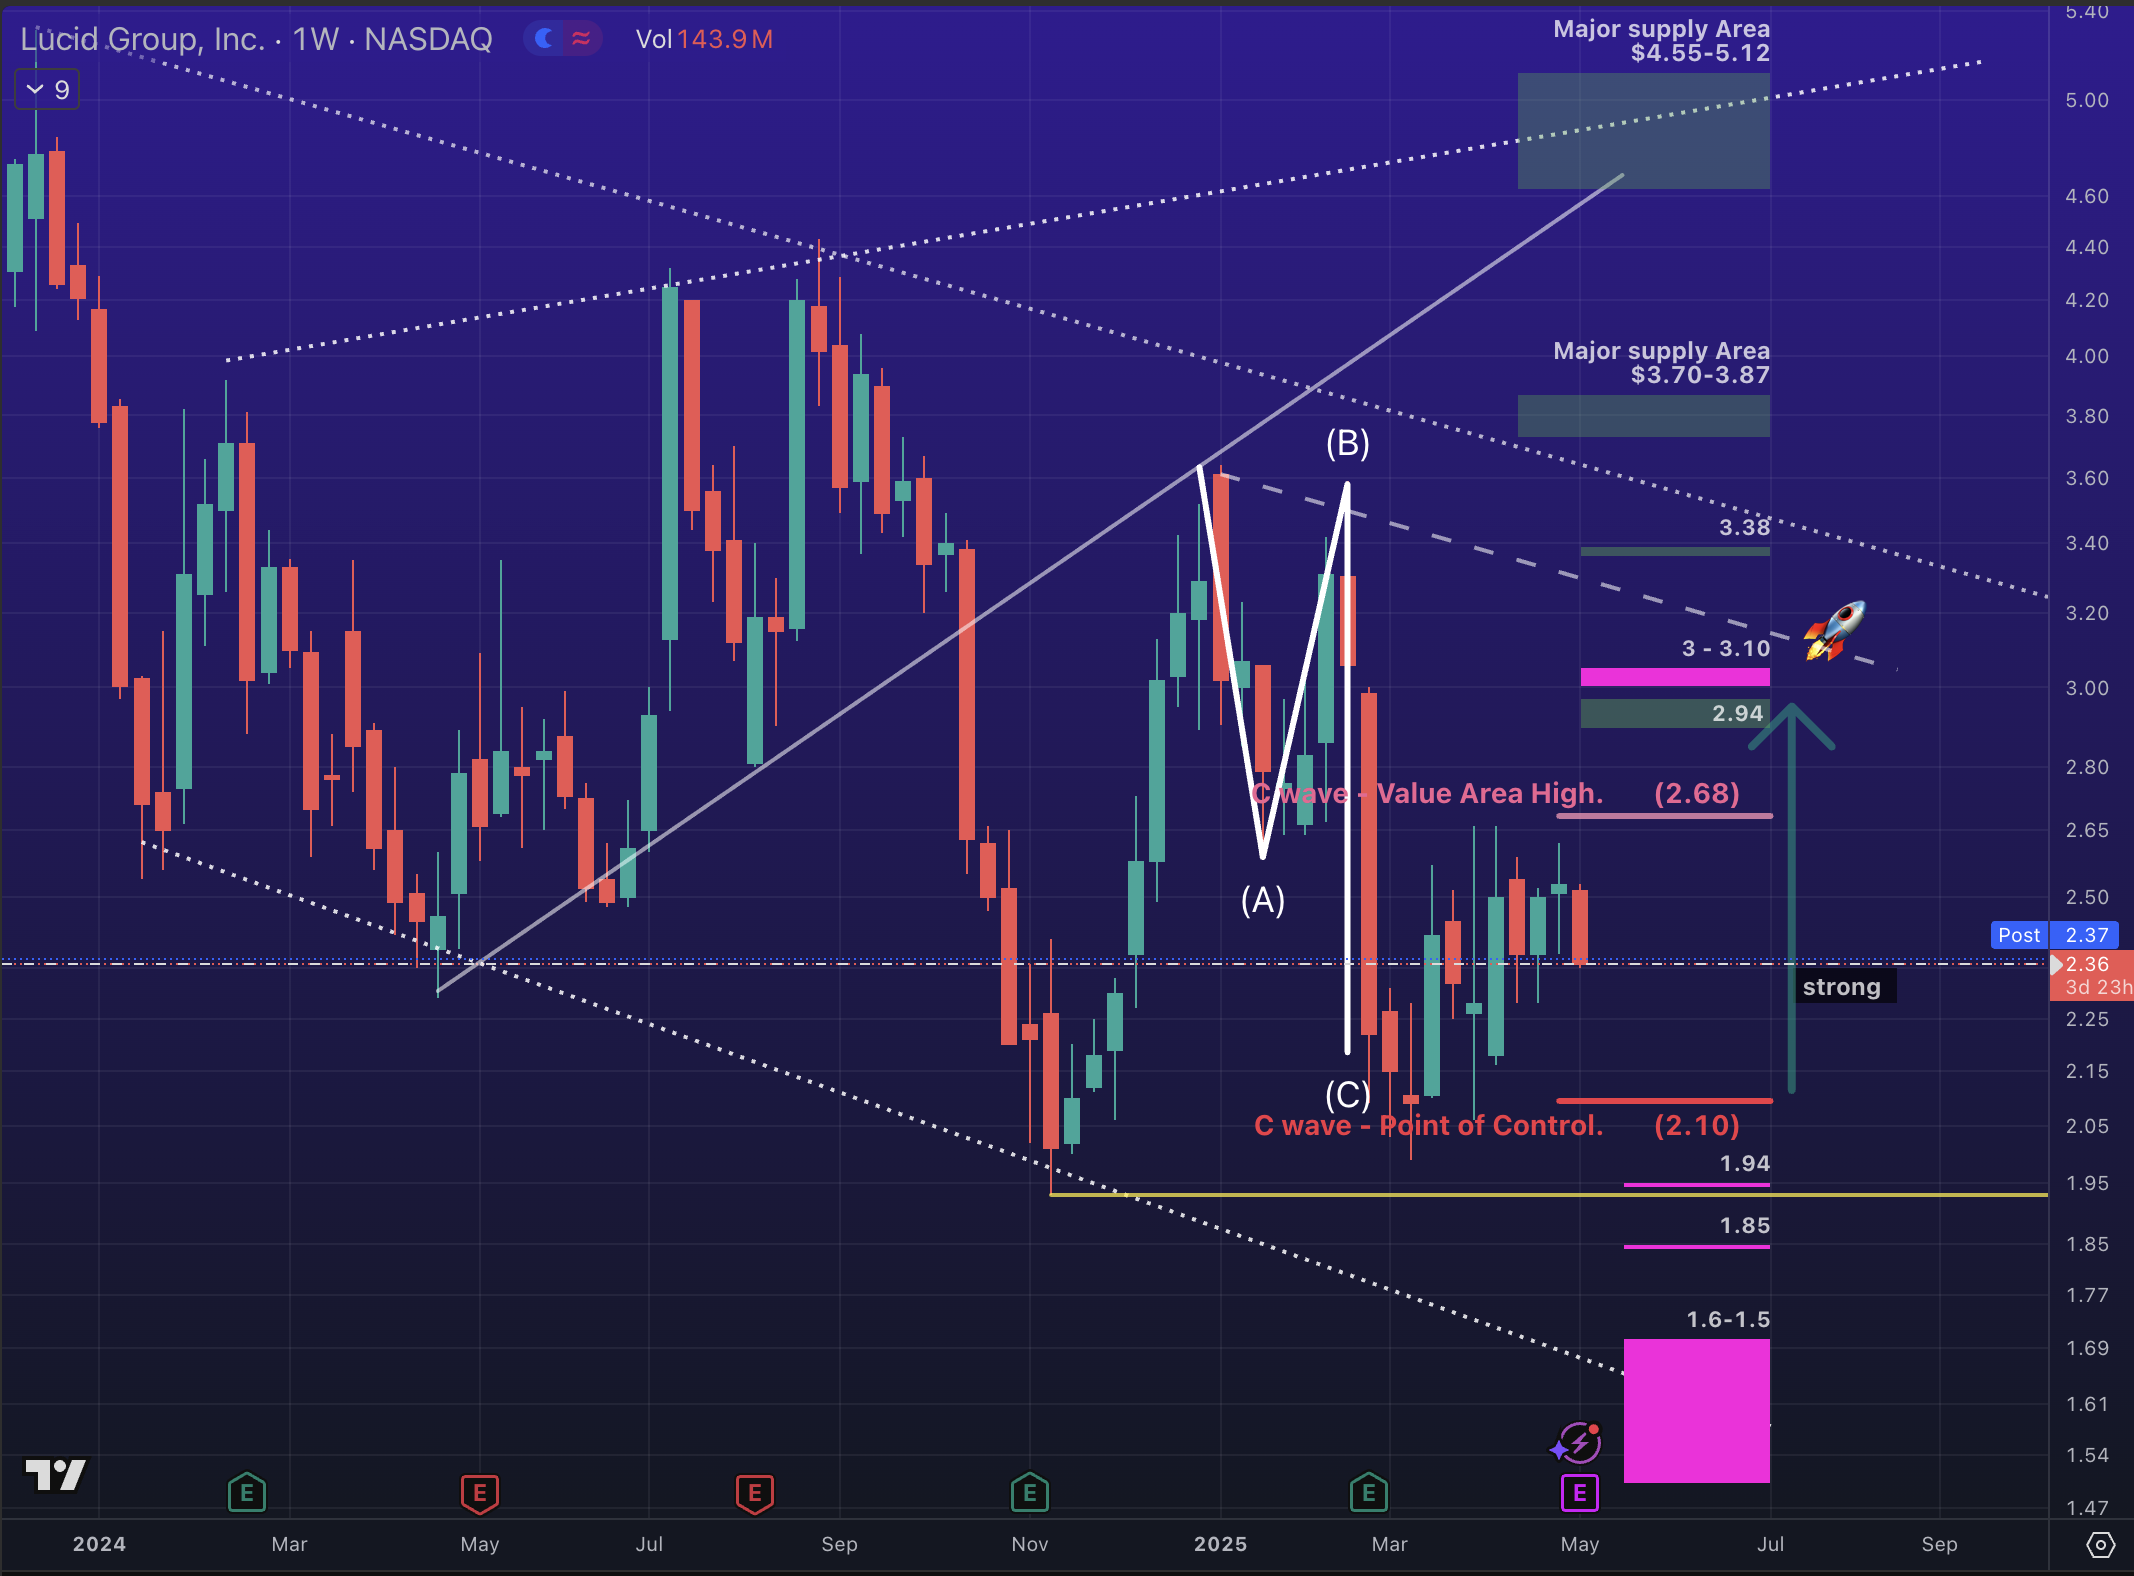
New Update..Things getting better
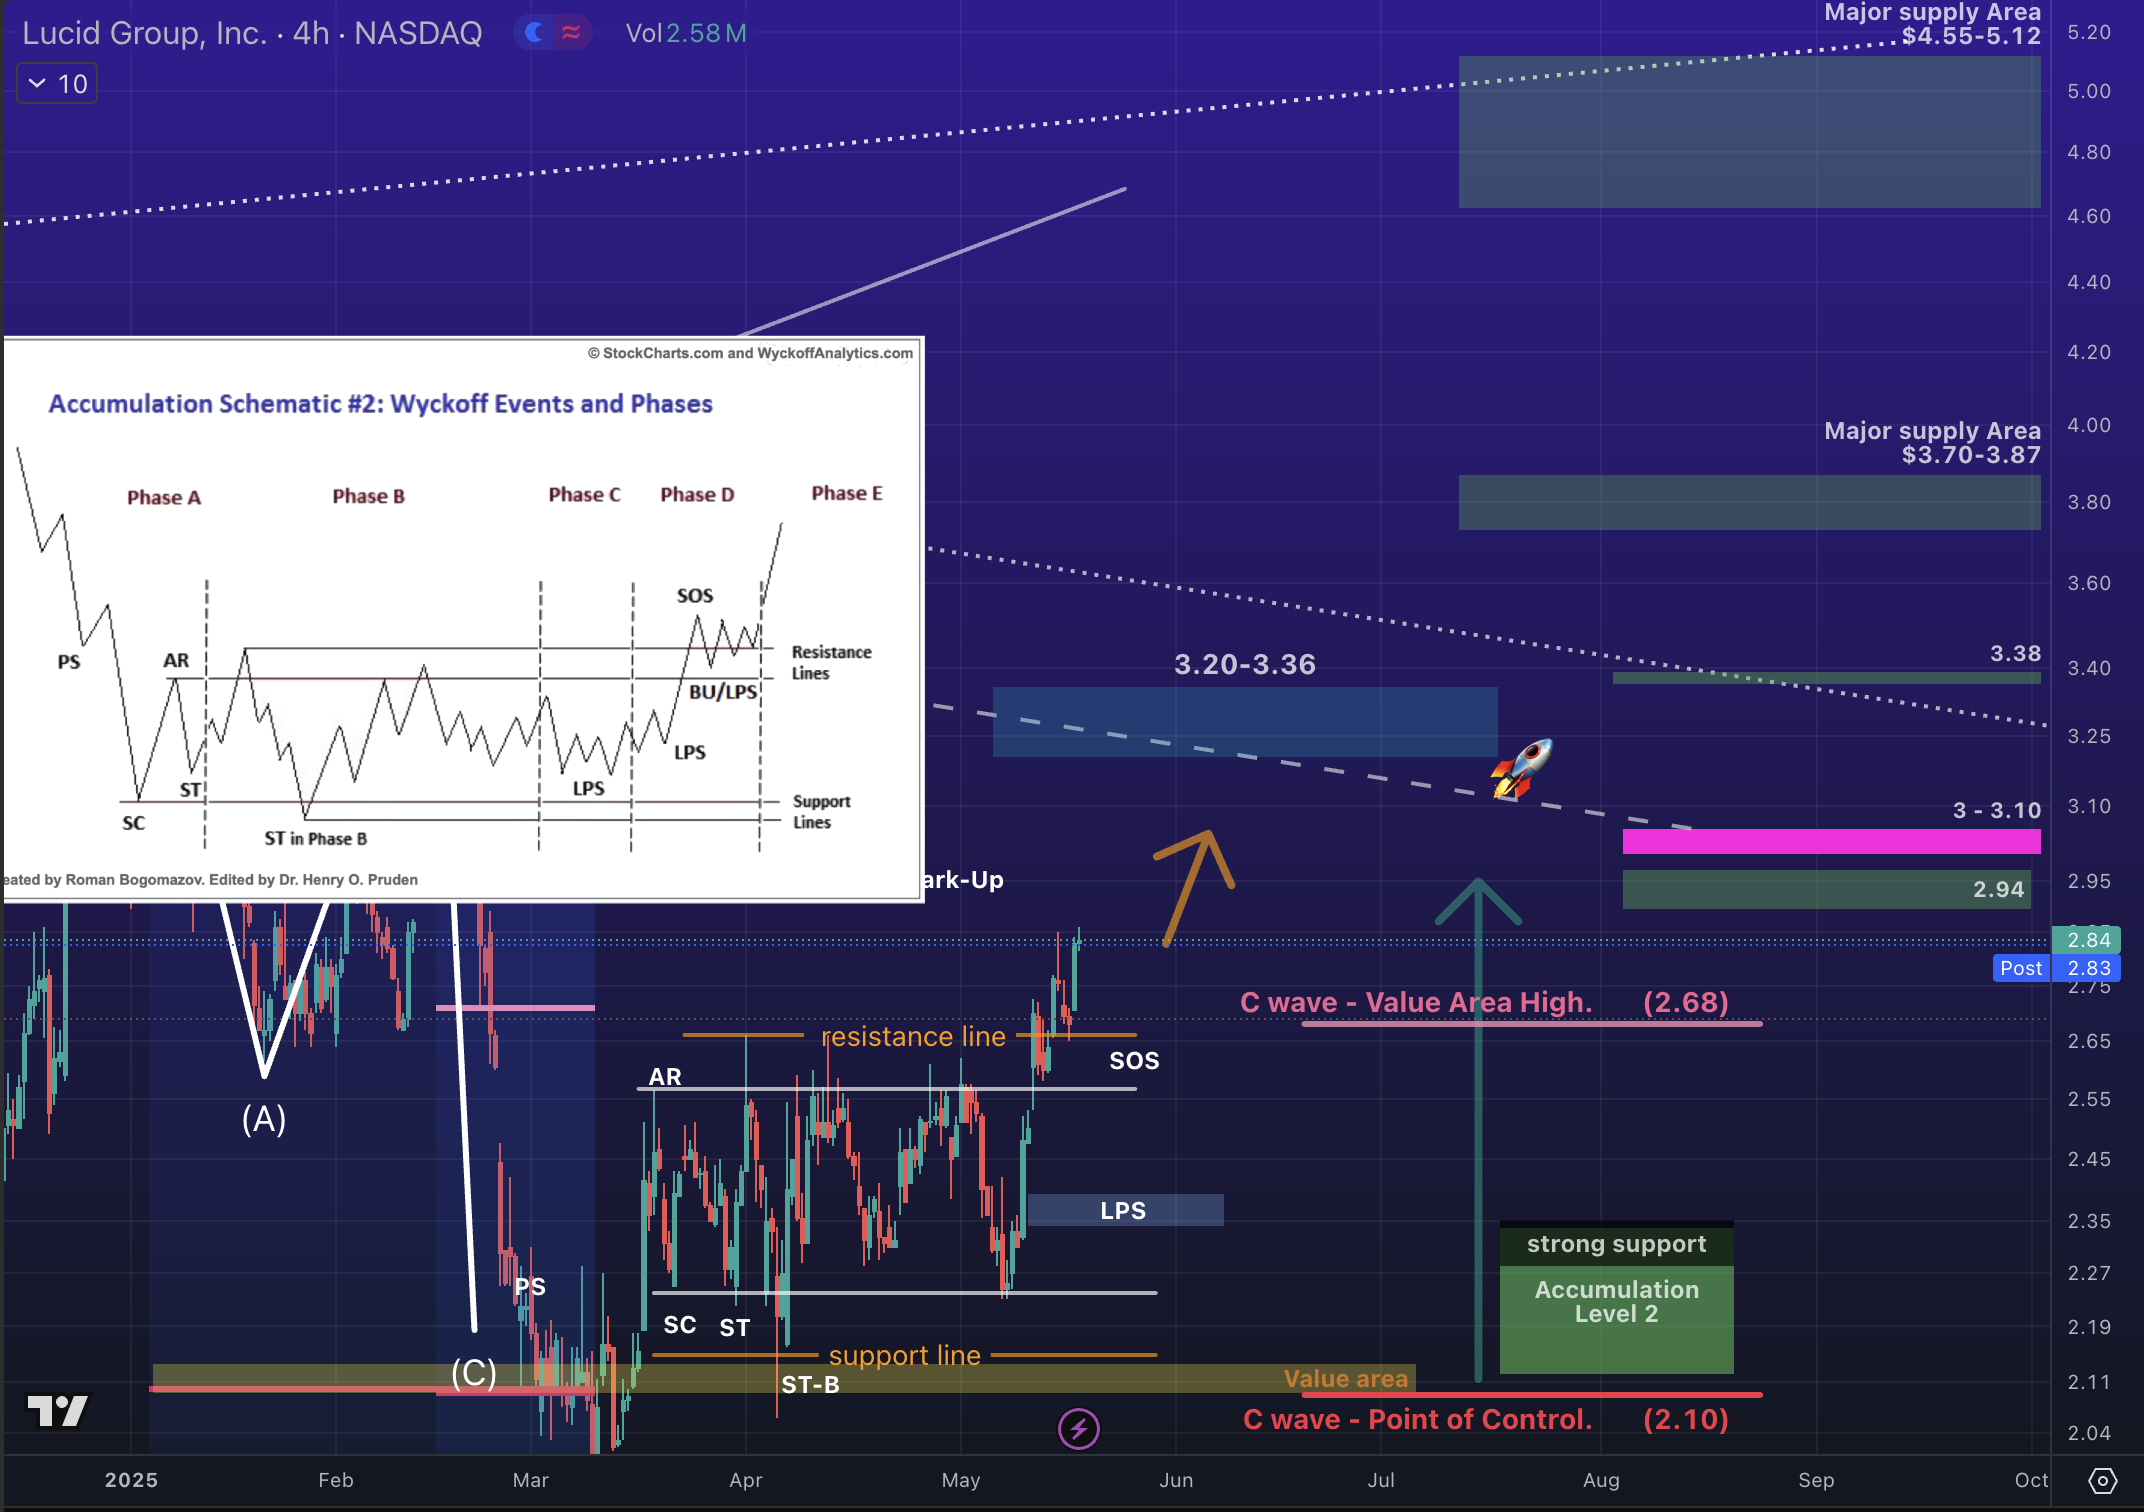
✅ we completed 2nd accumulation/re-accumulation level between $2.17 and $2.66
why? It allows stronger hands to absorb supply before the next leg higher. ((maybe fear of Trump tariffs))
🚀Bullish price targets when crossing $2.68
2.94 -> (3–3.10) -> 3.38 3.40 -> (4.55-5.12)
3.10 is key to achieve higher
🐻 Bearish price targets when crossing $2.10
1.99 Low -> 1.94 -> 1.85 -> (1.6-1.5)
2.10 2.17 is key to maintain bullishness
تحديث جديد.. الأمور تتحسّن
أنهينا مستوى التجميع/إعادة التجميع الثاني بين ٢.١٧ و٢.٦٦ ✅
لماذا؟ لأنه يسمح للأيدي القوية بامتصاص المعروض قبل المرحلة الصاعدة التالية. (ربما بسبب الخوف من رسوم ترامب الجمركية)
الأهداف السعرية الصاعدة عند تجاوز ٢٫٦٨ دولار 🚀
(٥٫١٢ – ٤٫٥٥) <- ٣٫٣٨ ٣،٤٠ <- (٣٫١٠ – ٣)<- ٢٫٩٤
٣٫١٠ هو المستوى الرئيسي لتحقيق ارتفاع أكبر
الأهداف السعرية الهابطة عند كسر ٢٫١٠ دولار 🐻
١٫٩٩ كأدنى سعر ← ١٫٩٤ ← ١٫٨٥ ← (١٫٦ – ١٫٥)
٢،١٧ ٢٫١٠ هو المستوى الأساسي للحفاظ على الاتجاه الصاعد
Wyckoff Method – منهج ويكوف
May 9, 2025
All posts are NOT to be interpreted or used as financial advice
لا يُفسَّر أو يُستخدم أي من المشاركات كنصائح مالية
For Investors للمستثمرين
📹 The video illustrates two potential scenarios based on the Wyckoff Method, both indicating a positive shift in volume and suggesting the market is currently in an accumulation phase.
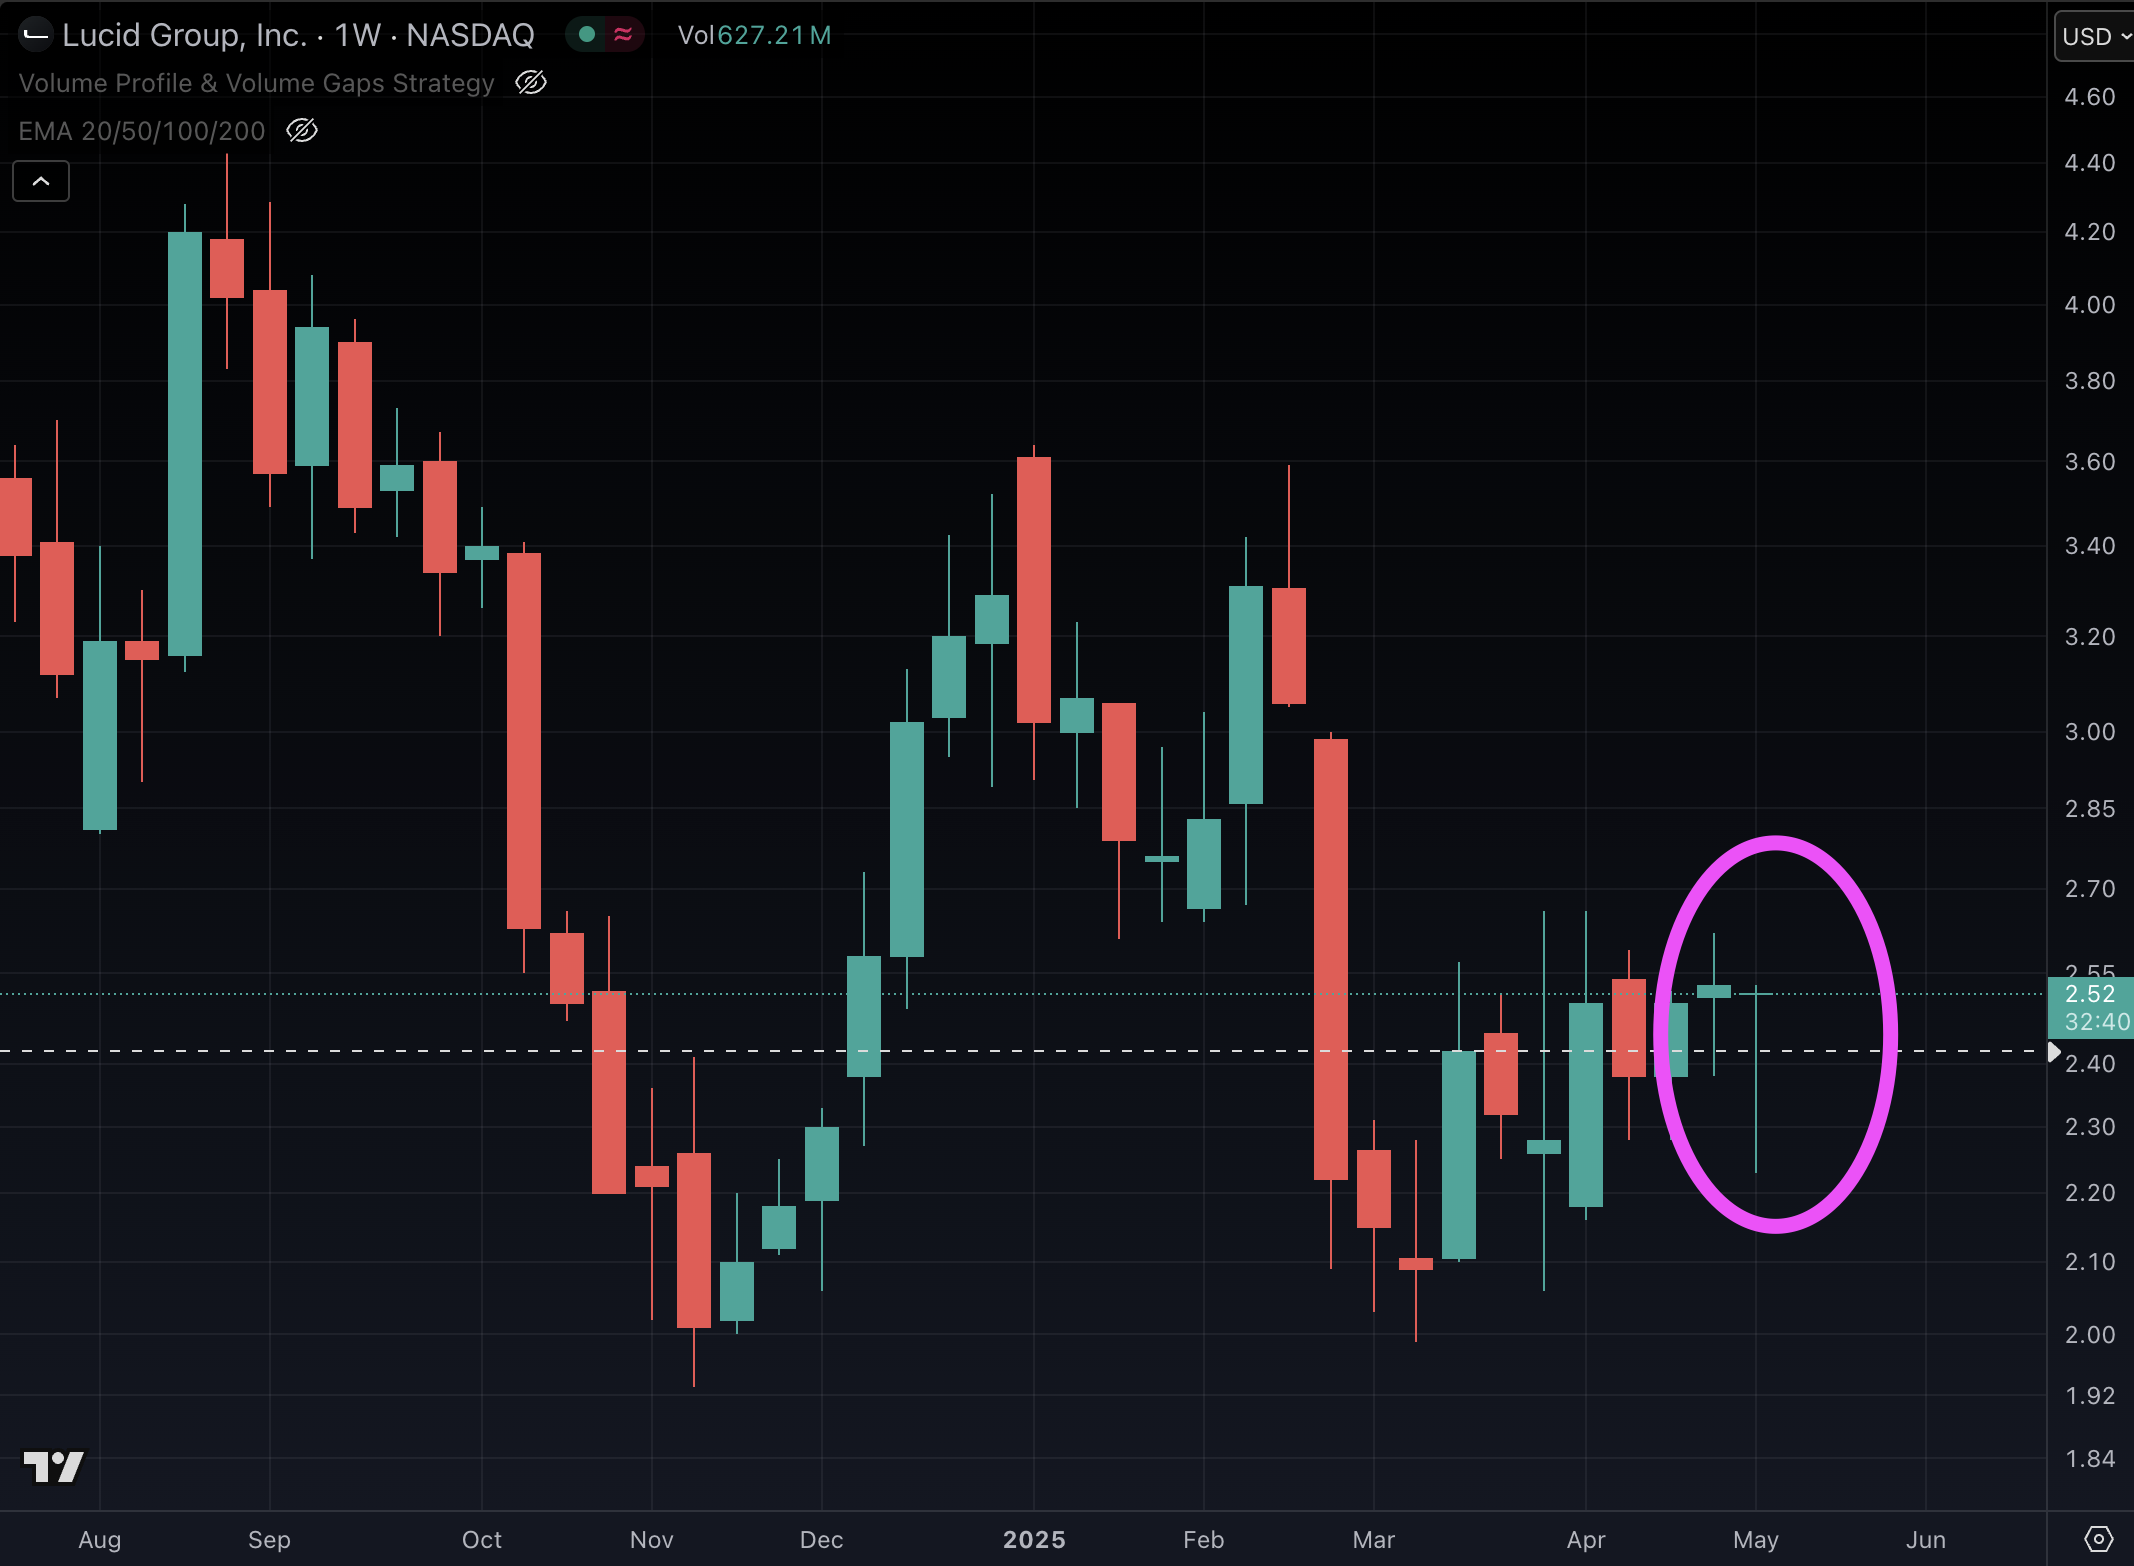
⭐️ The photo displays this week’s candle (a dragonfly doji), which signals a potential bullish reversal or the continuation of an upward price movement.
1️⃣
يُظهر الفيديو سيناريوهين محتملين مستندين إلى طريقة ويكوف، وكلاهما يشير إلى تحسُّن إيجابي في حجم التداول، مما يدل على أن السوق يمر بمرحلة تجميع
2️⃣
تُظهر الصورة شمعة هذا الأسبوع من نوع “دوجي اليعسوب”، وهي شمعة فنية قد تشير إلى انعكاس صعودي محتمل أو استمرار في الاتجاه الصاعد
Volume Profile – ملف الحجم والفجوات
May 5, 2025
All posts are NOT to be interpreted or used as financial advice
لا يُفسَّر أو يُستخدم أي من المشاركات كنصائح مالية
Q1 2025 Earnings Special
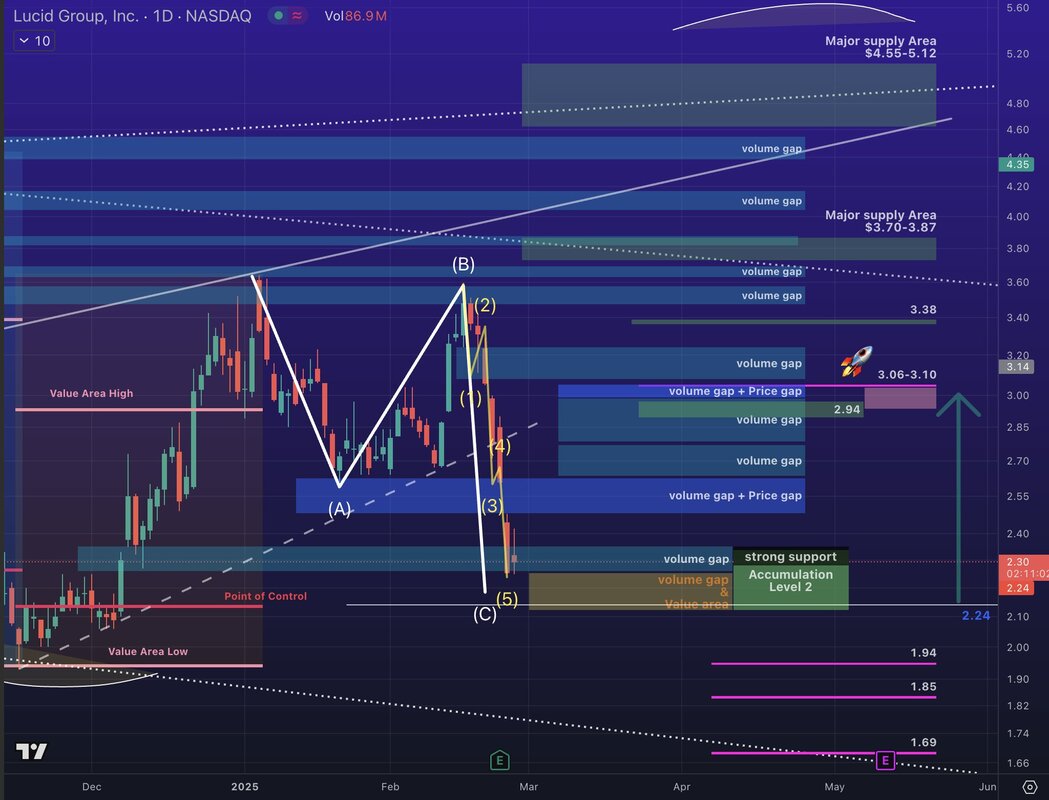
✅ $LCID stock in accumulation structure since past 27 February. No major breakout yet!
🚀Bullish price targets when crossing $2.68
2.94 -> (3–3.10) -> 3.38 -> (4.55-5.12)
3.10 is key to achieve higher
🐻 Bearish price targets when crossing $2.10
1.99 Low -> 1.94 -> 1.85 -> (1.6-1.5)
2.10 is key to maintain bullishness
السهم في هيكل تجميعي منذ ٢٧ فبراير، ولم يحدث أي اختراق كبير حتى الآن ✅
الأهداف السعرية الصاعدة عند تجاوز ٢٫٦٨ دولار 🚀
(٥٫١٢ – ٤٫٥٥) <- ٣٫٣٨ <- (٣٫١٠ – ٣)<- ٢٫٩٤
٣٫١٠ هو المستوى الرئيسي لتحقيق ارتفاع أكبر
الأهداف السعرية الهابطة عند كسر ٢٫١٠ دولار 🐻
١٫٩٩ كأدنى سعر ← ١٫٩٤ ← ١٫٨٥ ← (١٫٦ – ١٫٥)
٢٫١٠ هو المستوى الأساسي للحفاظ على الاتجاه الصاعد
Volume Profile & Gaps ملف الحجم والفجوات
February 27 , 2025
✅ Major ABC correction confirmed on Feb 5, holding between $2.25 and $2.12. No volume for further drop.
🚀 Price targets upon crossing $3.06-$3.10:
3.38 -> (3.7–3.87) -> (4.55–5.12)
🐻 Bearish scenarios on chart.
🔒 I expect a sharp fall to at least $2.3 after peak.
.تم تأكيد تصحيح (أ ب ج) الرئيسي في 5 فبراير، مستقر بين 2.25 و 2.12 دولار ✅
الأهداف السعرية عند تجاوز 3.06$ – 3.10 دولار 🚀
(4.55–5.12) ← (3.7–3.87) ← 3.38
.السيناريوهات الهبوطية موضحة في الرسم البياني 🐻
.أتوقع هبوطًا حادًا إلى 2.3$ على الأقل بعد القمة 🔒

Leave a Reply اترك تعليق