

Volume Profile+NVWAP – ملف الحجم والفجوات
العربي تحت الانجليزي
Jun 1 , 2025 (updated Oct 1)
All posts are NOT to be interpreted or used as financial advice
لا يُفسَّر أو يُستخدم أي من المشاركات كنصائح مالية
All options are on🐂 V.S. 🐻
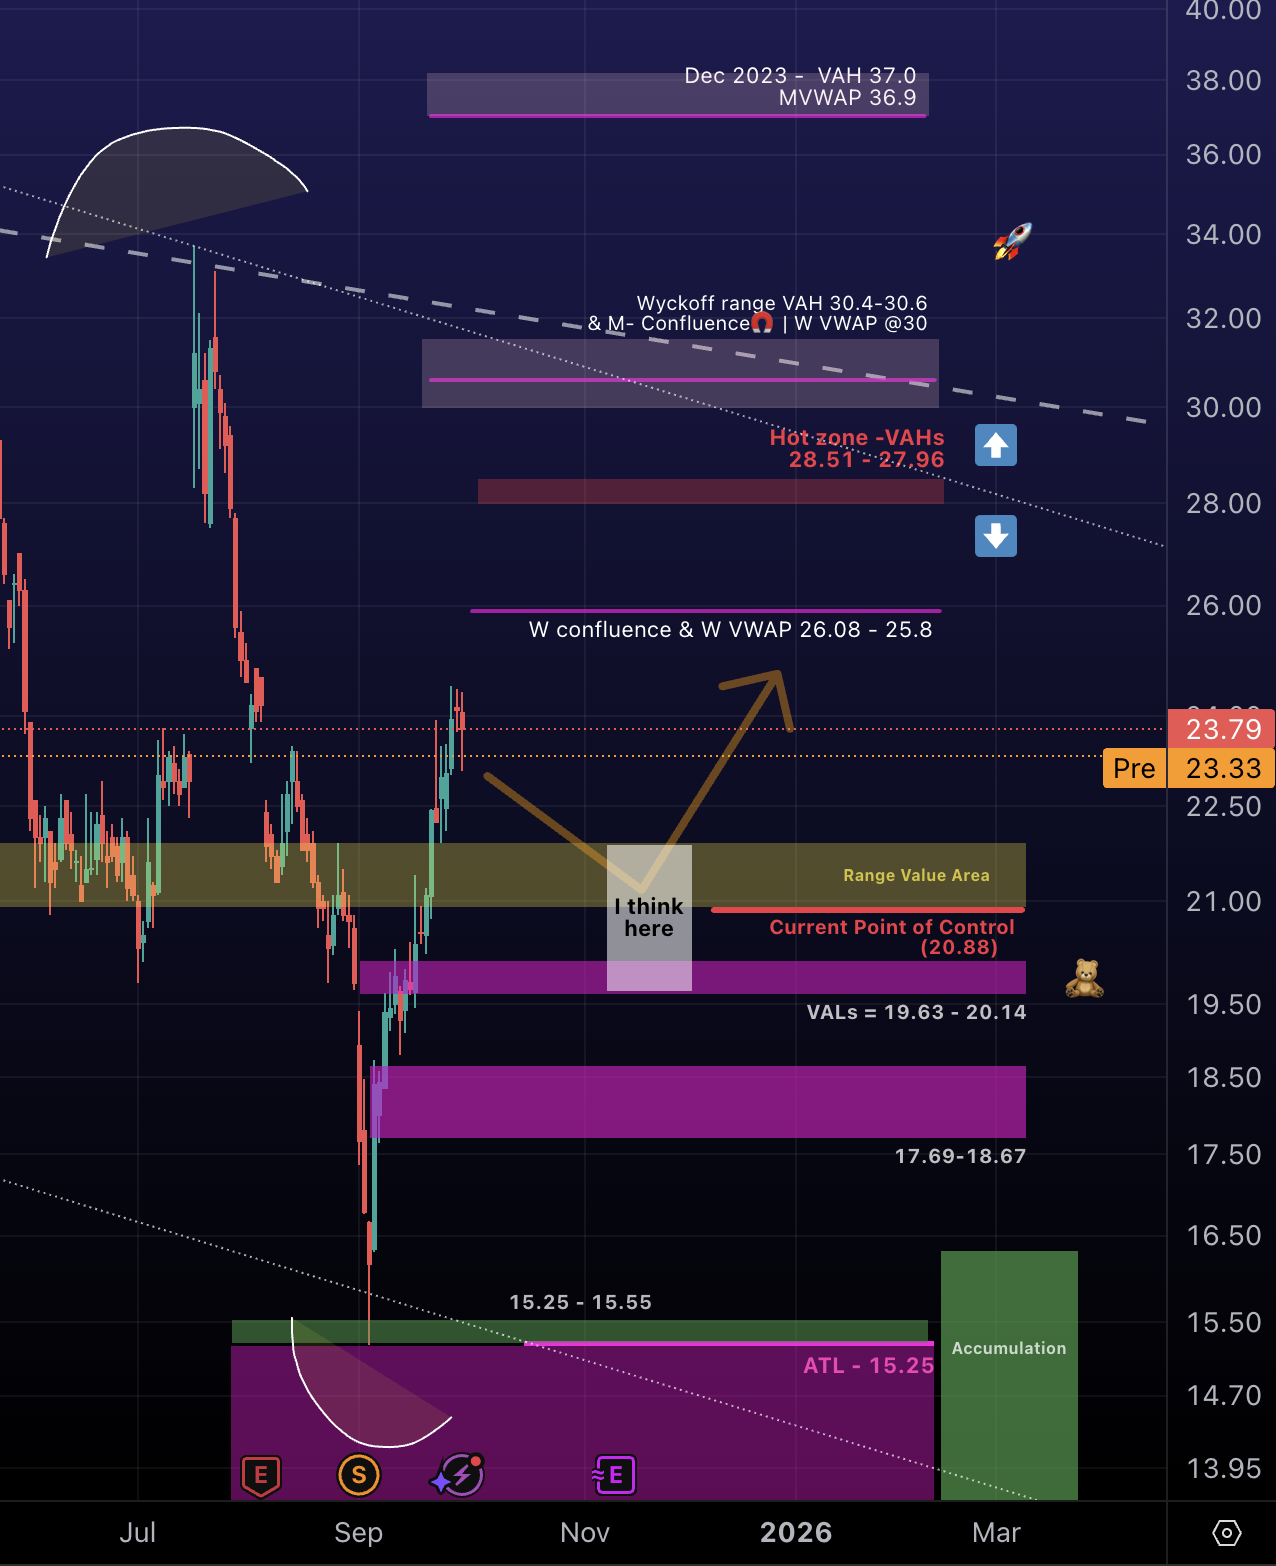
$LCID has broken below its previous all-time low of $19.3, setting a new ATL at $15.25. The chart now stands at a crossroads: sellers remain in control beneath major resistance, but the roadmap highlights where momentum could flip back to strength.
📍 Current level: $23.3, trading above the current range POC 20.88 — bulls are attempting to reclaim control.
🔻 Downside Bearish zones:
19.63 – 20.14 (VALs) → support / possible bounce.
17.7 – 18.7 → strong cluster, may act as a short-term floor.
15.25 – 15.55 (ATL/Accumulation) → max fear, but also heavy accumulation zone.
🟢 Upside Bullish zones:
20.8 reclaim → flips momentum back to neutral/bullish.
26.0 – 25.8 (W confluence & W VWAP) → key mid-resistance test.
27 – 28 (Hot Zone) → heavy resistance where trapped longs may sell.
30.4 – 30.6 (Wyckoff range + W VWAP confluence) → critical breakout zone for trend reversal.
36 – 37 (Dec ’23 VWAP/VAH) → full recovery target if bulls fully take control.
👉 The fight is simple: defend 18–16 or reclaim 21+ to hold momentum upward.
30.6-30.4 is key to achieve higher
Personally, I started accumulating again between 15-16.5
سهم لوسيد كسر أدنى مستوى تاريخي سابق عند ١٩٫٣ دولار، وسجل قاعاً جديداً عند ١٥٫٢٥ دولار. يقف السهم حالياً عند نقطة حاسمة: البائعون ما زالوا مسيطرين أسفل مستويات المقاومة الرئيسية، لكن خارطة الطريق توضح أين يمكن أن تنعكس القوة من جديد لصالح المشترين
📌المستوى الحالي
٢٣٫٣ دولار (قبل الافتتاح)، ويتداول فوق نقطة التحكم الحالية عند ٢٠٫٨٨ دولار — مما يشير إلى محاولة المشترين استعادة السيطرة
🔴المناطق السفلية
عند ١٧٫٩٠: دعم ثانوي قد يبطئ من وتيرة الهبوط مؤقتًا
عند ١٦٫١٠: منطقة متماسكة غالبًا ما تشهد ارتدادًا
بين ١٢ و١٥: منطقة الخوف الأقصى، ولكنها أيضًا منطقة محتملة لتجميع المشترين على المدى الطويل
🟢المناطق العلوية
١٩٫٦ – ٢٠٫١ (منطقة قيمة منخفضة) – قد تعمل كدعم أو نقطة ارتداد مؤقتة
١٧٫٧ – ١٨٫٧ – منطقة تجمّع قوية قد تشكّل أرضية قصيرة الأجل
١٥٫٢٥ – ١٥٫٥٥ (أدنى قاع تاريخي / منطقة تراكم) – مستوى الخوف الأقصى، لكن أيضاً منطقة دخول لمشترين طويل الأمد
👉 الخلاصة
المعركة واضحة: الدفاع عن منطقة ١٨ – ١٦ أو استعادة مستويات ٢١ فما فوق للحفاظ على الزخم الصاعد
شخصيًا بدأت إعادة التجميع من جديد بين ١٥ – ١٦٫٥
Volume Profile Pro – ملف الحجم الاحترافي
updated – Sep 6 , 2025
All posts are NOT to be interpreted or used as financial advice
لا يُفسَّر أو يُستخدم أي من المشاركات كنصائح مالية
Chart Guide
💡 Tip: You can also run this chart through any AI analysis tool to get automated insights about these color-coded zones.
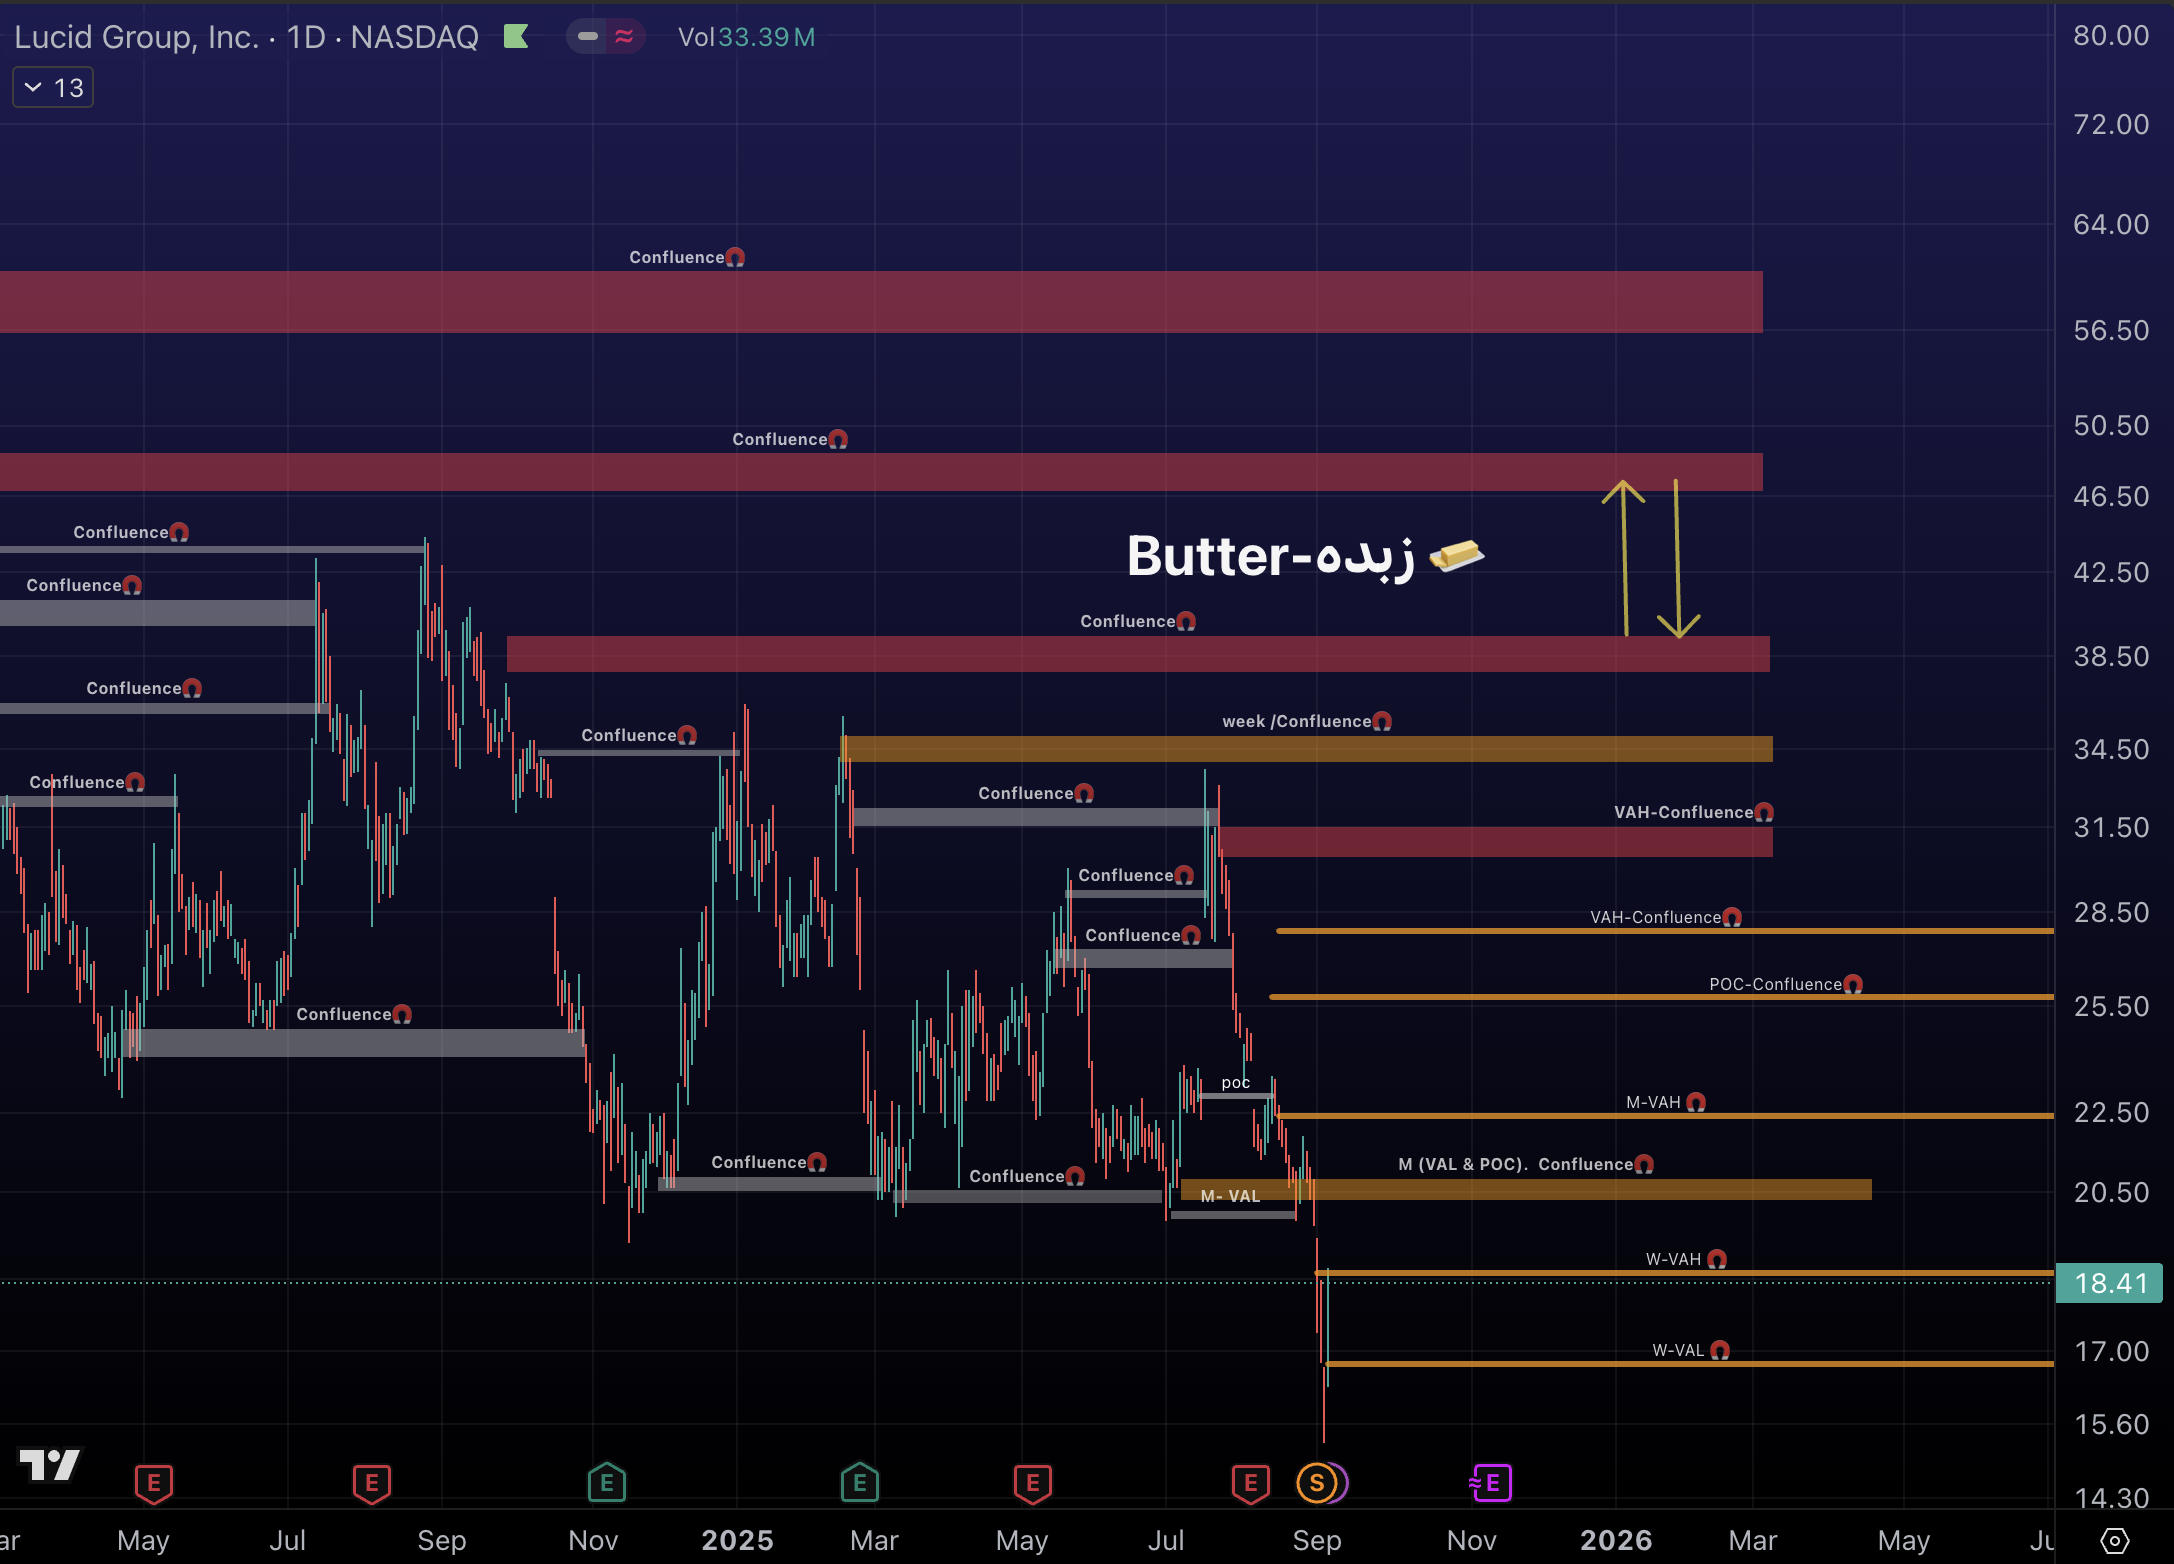
This chart highlights different zones of interest using colors and trading terms:
◻️Gray zones → areas already taken/used by price action; these show where the market has previously fought hard.st trading activity, which often act as support or resistance in the future.
🔴Red zones → resistance areas where sellers are usually stronger.
🟡Yellow/Orange zones → key pivot points such as POC (Point of Control) or VAH/VAL (Value Area High/Low), which often decide short-term direction.
دليل الرسم البياني
ملاحظة: يمكنك أيضًا استخدام أي أداة تحليل بالذكاء الاصطناعي للحصول على قراءات تلقائية لهذه المناطق الملوّنة
هذا الرسم يوضح مناطق الاهتمام المختلفة باستخدام الألوان والمصطلحات
المناطق الرمادية : مناطق تم استهلاكها بالفعل بحركة السعر، وهي تظهر الأماكن التي شهدت صراعًا قويًا سابقًا
المناطق الحمراء : مناطق مقاومة يكون فيها البائعون عادةً أقوى
المناطق الصفراء/البرتقالية : نقاط محورية مهمة مثل نقطة التحكم أو قمة/قاع منطقة القيمة (اعلى قيمة حجمية /اقل قيمة حجمية)، وغالبًا ما تحدد اتجاه الحركة على المدى القصير
Wyckoff Method – منهج ويكوف
June 2 , 2025 (July 10 – no change)
All posts are NOT to be interpreted or used as financial advice
لا يُفسَّر أو يُستخدم أي من المشاركات كنصائح مالية
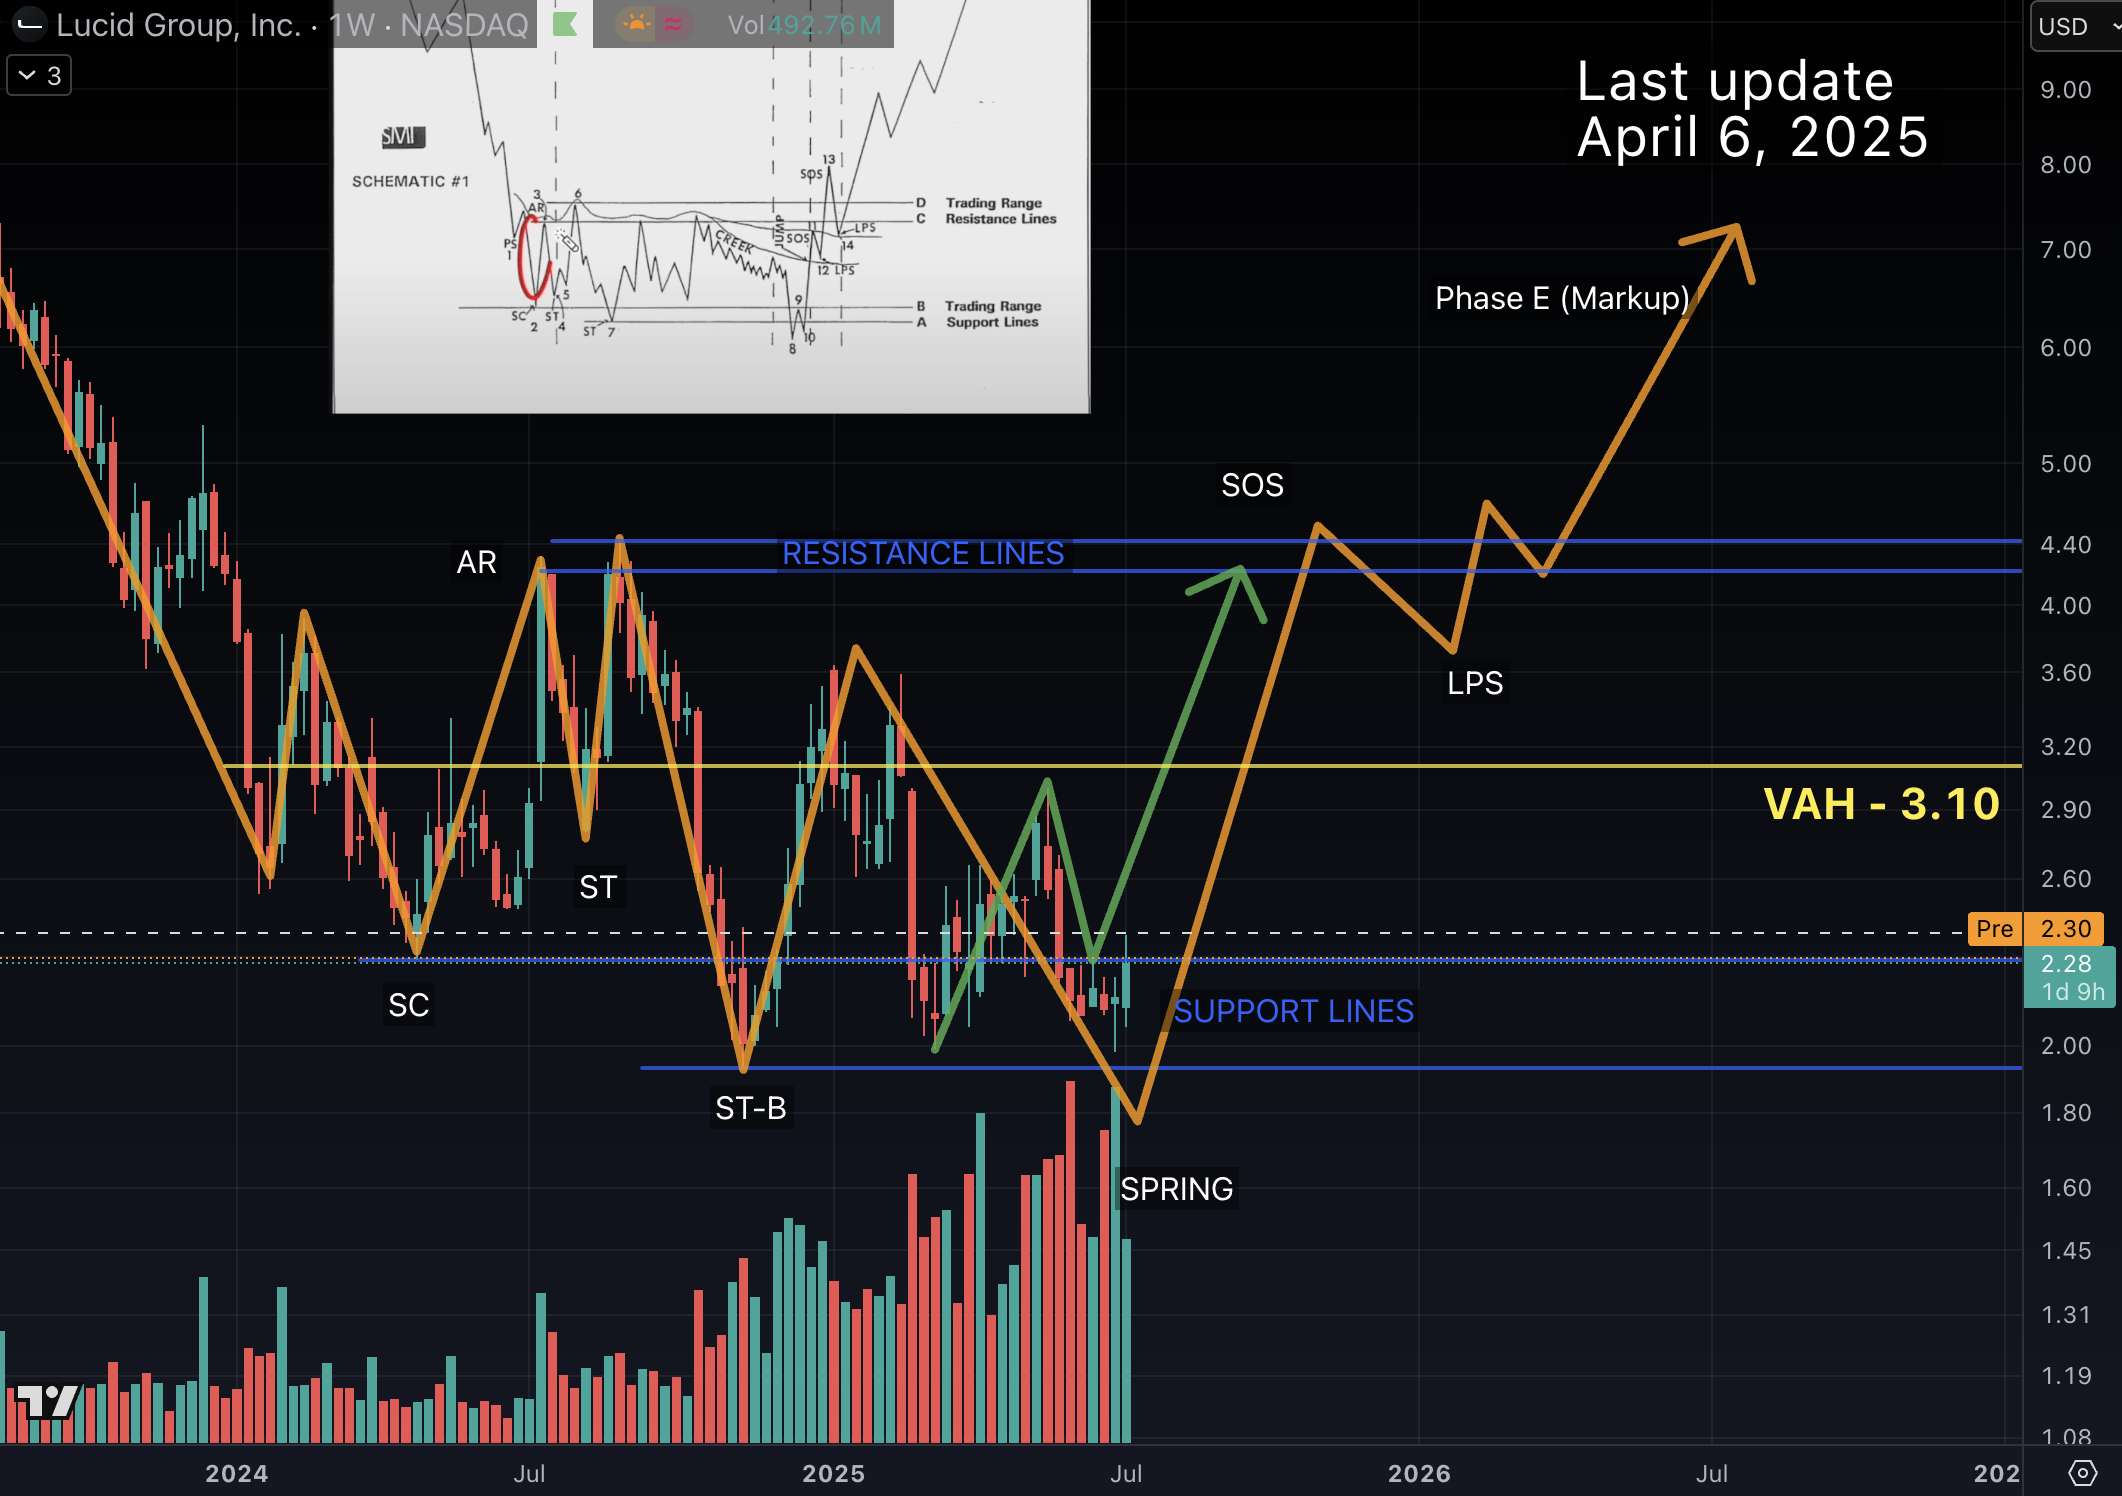
The analysis helps traders identify accumulation patterns, potential spring action, and breakout targets based on classic Wyckoff methodology
The green line represents a potential and very valid bottoming pattern for Lucid, suggesting a possible price recovery around $2.25
July 10 Update: $3.10 is the Value Area High for this range. Since price entered the support zone, I expect a rejection around or below $3.10. This could send price below $1.94 — confirmation comes if price fail to break and hold above $3.10.
The orange line represents another potential and very valid bottoming pattern for Lucid, suggesting a possible price recovery below $1.94
يساعد هذا التحليل المتداولين على التعرف على نماذج التجميع، وحركة “الربيع او الانطلاق” المحتملة، وأهداف الاختراق بناءً على منهجية وايكوف الكلاسيكية
الخط الأخضر يُمثل نموذج قاع محتمل وقوي لسهم لوسيد، ويُشير إلى احتمال تعافي السعر حول مستوى ٢٫٢٥ دولار
تحديث ١٠ يوليو: مستوى ٣٫١٠ دولار هو الحد العلوي لمنطقة القيمة في هذا النطاق. بما أن السعر دخل منطقة الدعم، أتوقع رفضًا بالقرب من أو أقل من ٣٫١٠ دولار، مما قد يدفع السعر إلى ما دون ١٫٩٤ دولار. ويتم التأكيد في حال فشل السعر في اختراق والثبات فوق ٣٫١٠ دولار
الخط البرتقالي يُمثل أيضًا نموذج قاع محتمل وقوي لسهم لوسيد، ويُشير إلى احتمال تعافي السعر من مستويات أقل من ١٫٩٤ دولار

Leave a Reply اترك تعليق